View task health and status with Mephisto Metrics
Mephisto provides an optional extension to view task health metrics via dashboard using Prometheus and Grafana. This lets you see the progress of your task with the following:
Seem exciting? Let's dig in!
Note: Mephisto 1.0's metrics implementation is limited to supporting just one concurrent Operator at a time. Attempts to launch with a second Operator at the same time may leave the metrics for both runs corrupted, though this shouldn't prevent you from collecting data.
Installation
Installation is easy, just run the setup script:
mephisto metrics install
This script creates a local prometheus and grafana folder in mephisto's metrics directory, and populates them with default configurations for being able to view Mephisto run metrics.
Usage
Once you have metrics installed, all future runs will be logging metrics by default. You can view these metrics with:
mephisto metrics view
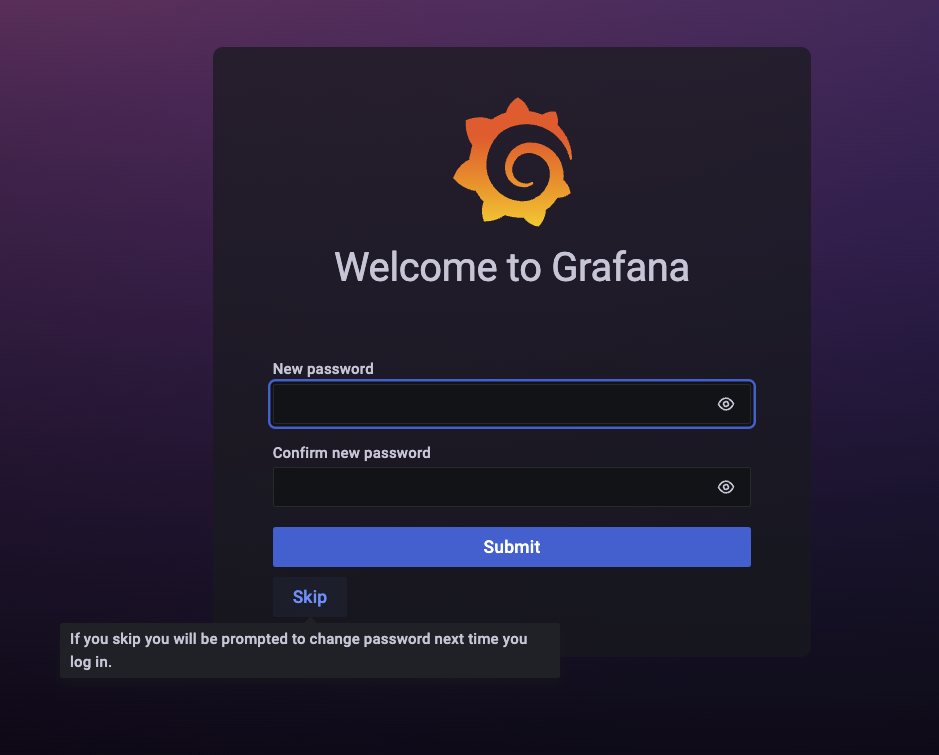
This script will launch a grafana server on port 3032 and give you the link to view your metrics. Following the link will take you to a login screen. By default, the username and password are both admin.
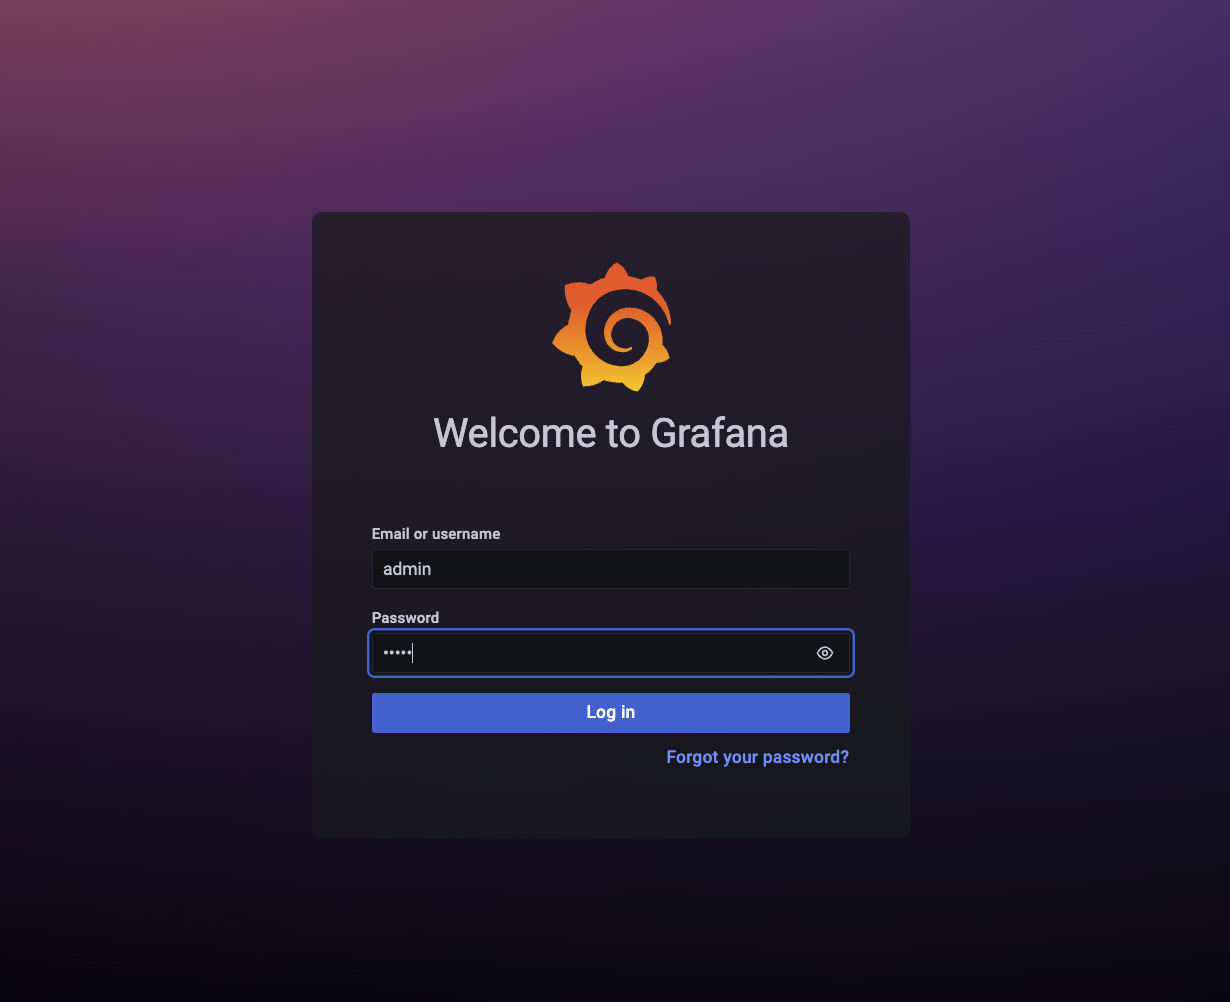
If you're using these metrics locally on a machine that's not publicly accessible, you can certainly skip the step of setting up a real account.
Once you're inside, you can restrict to the region you're interested by dragging on a graph:
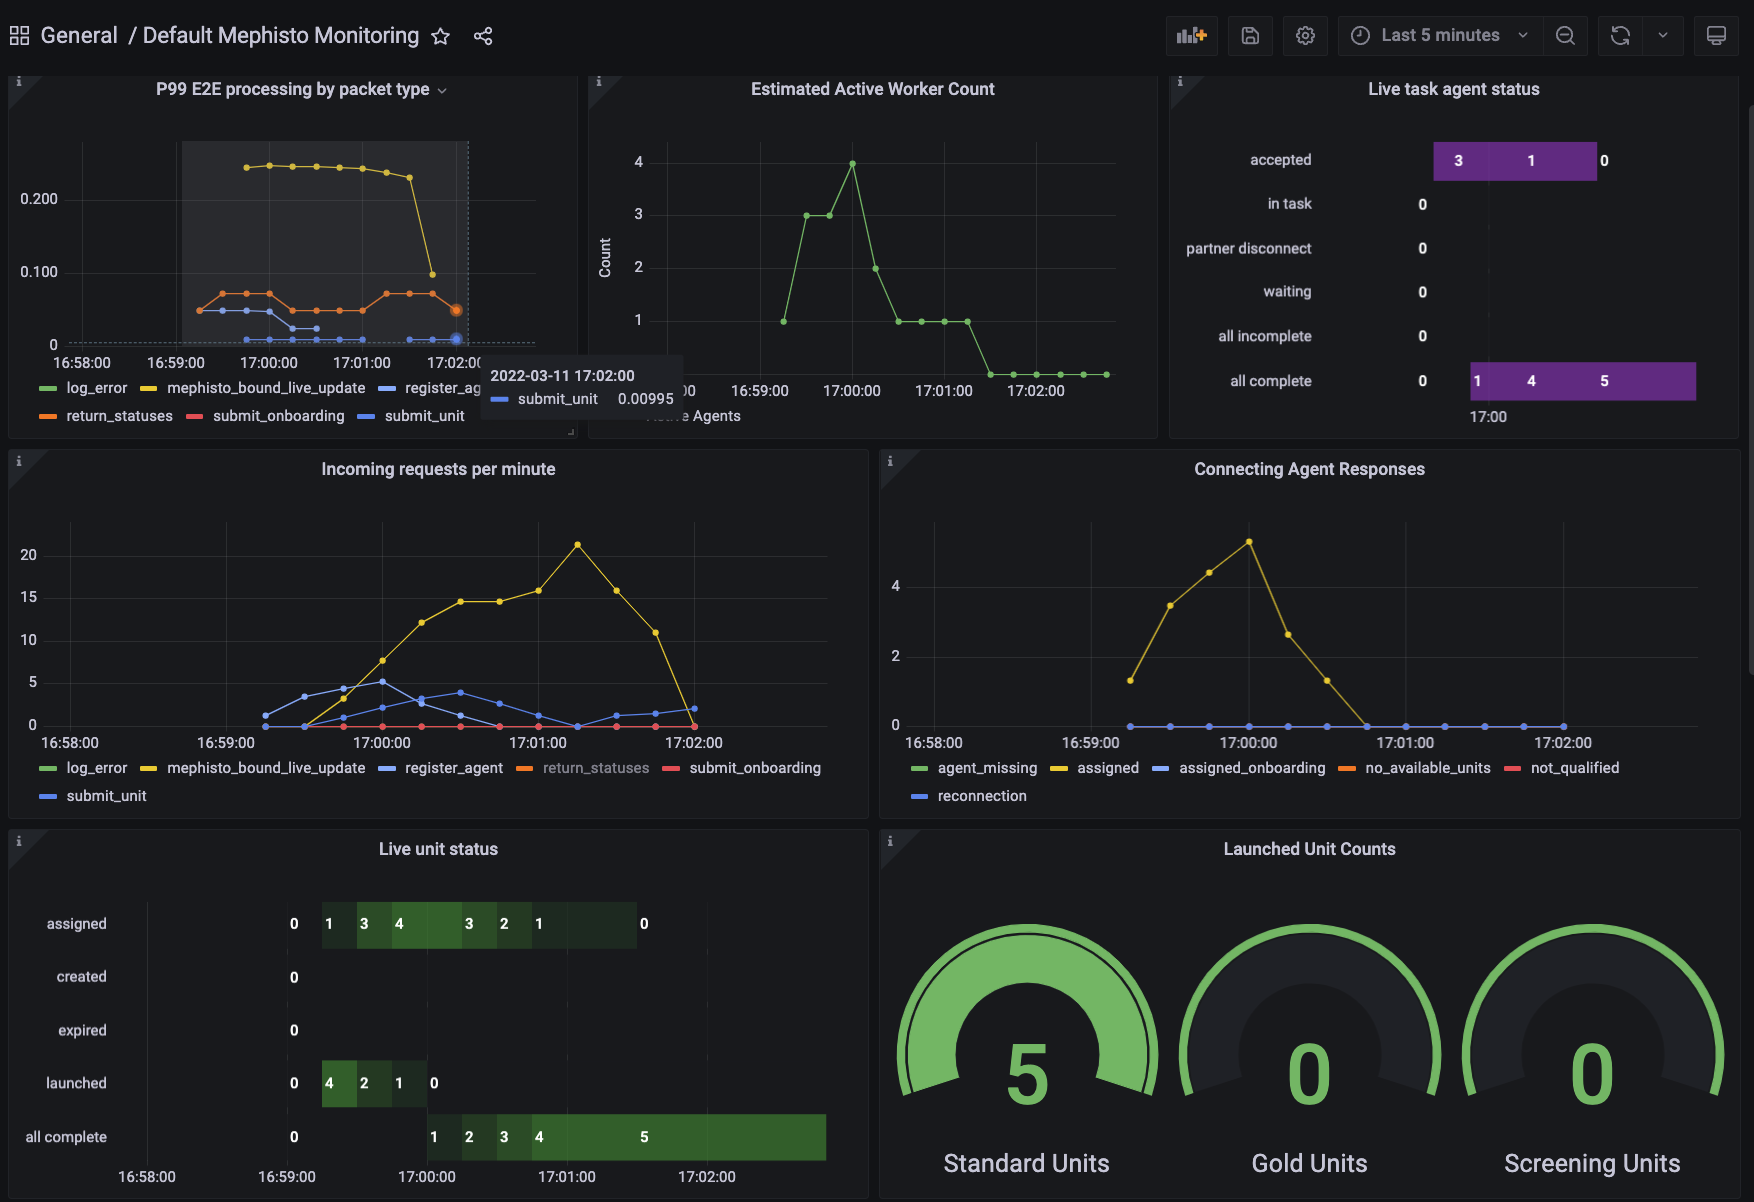
At any time you can reset the time period with the dropdown in the top right.
Default Dashboards
Mephisto creates a number of useful panes for most average use cases, though you are free to extend and create your own dashboards if you're familiar with prometheus's query language. The following sections describe the main dashboards and the core insights you get from them.
General Health
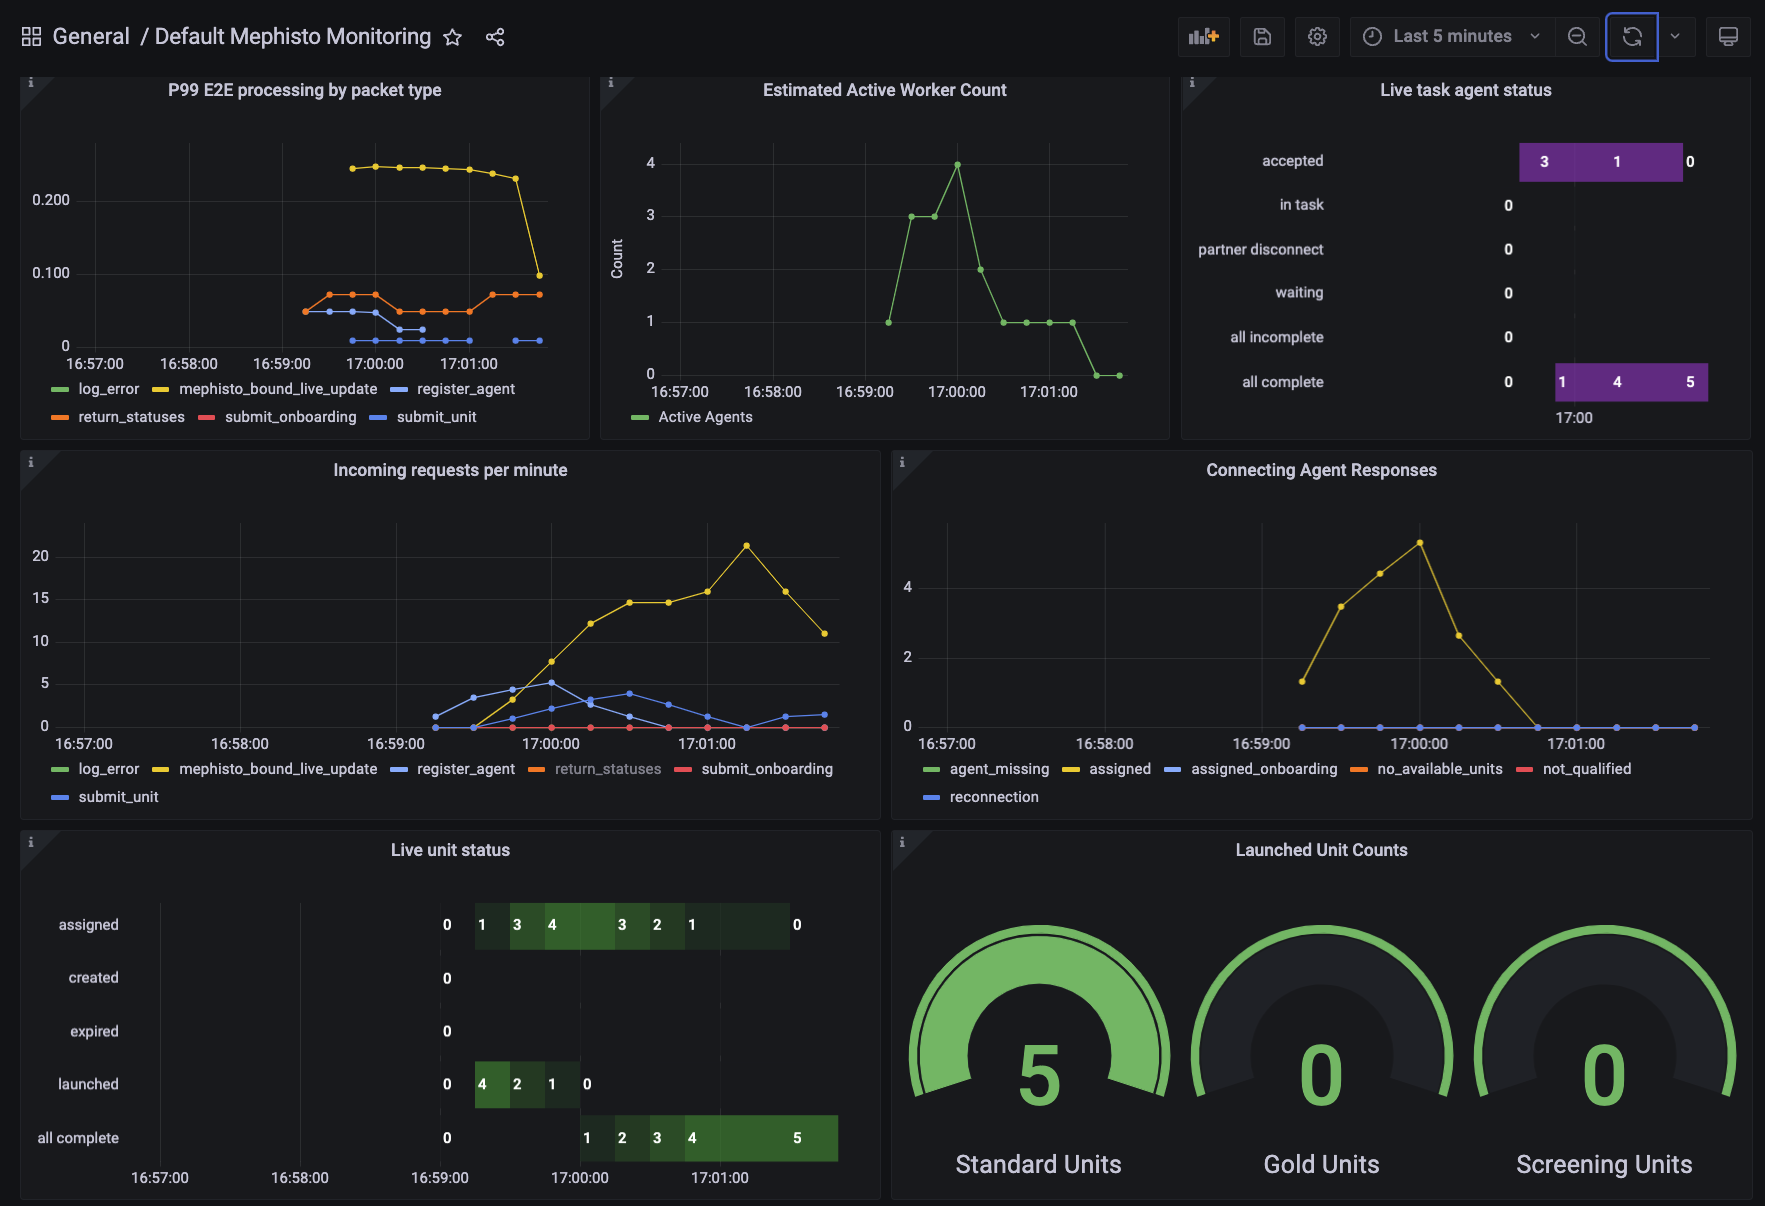
The general health group contains all of the top-line metrics that are relevant for knowing what's going on with your run:
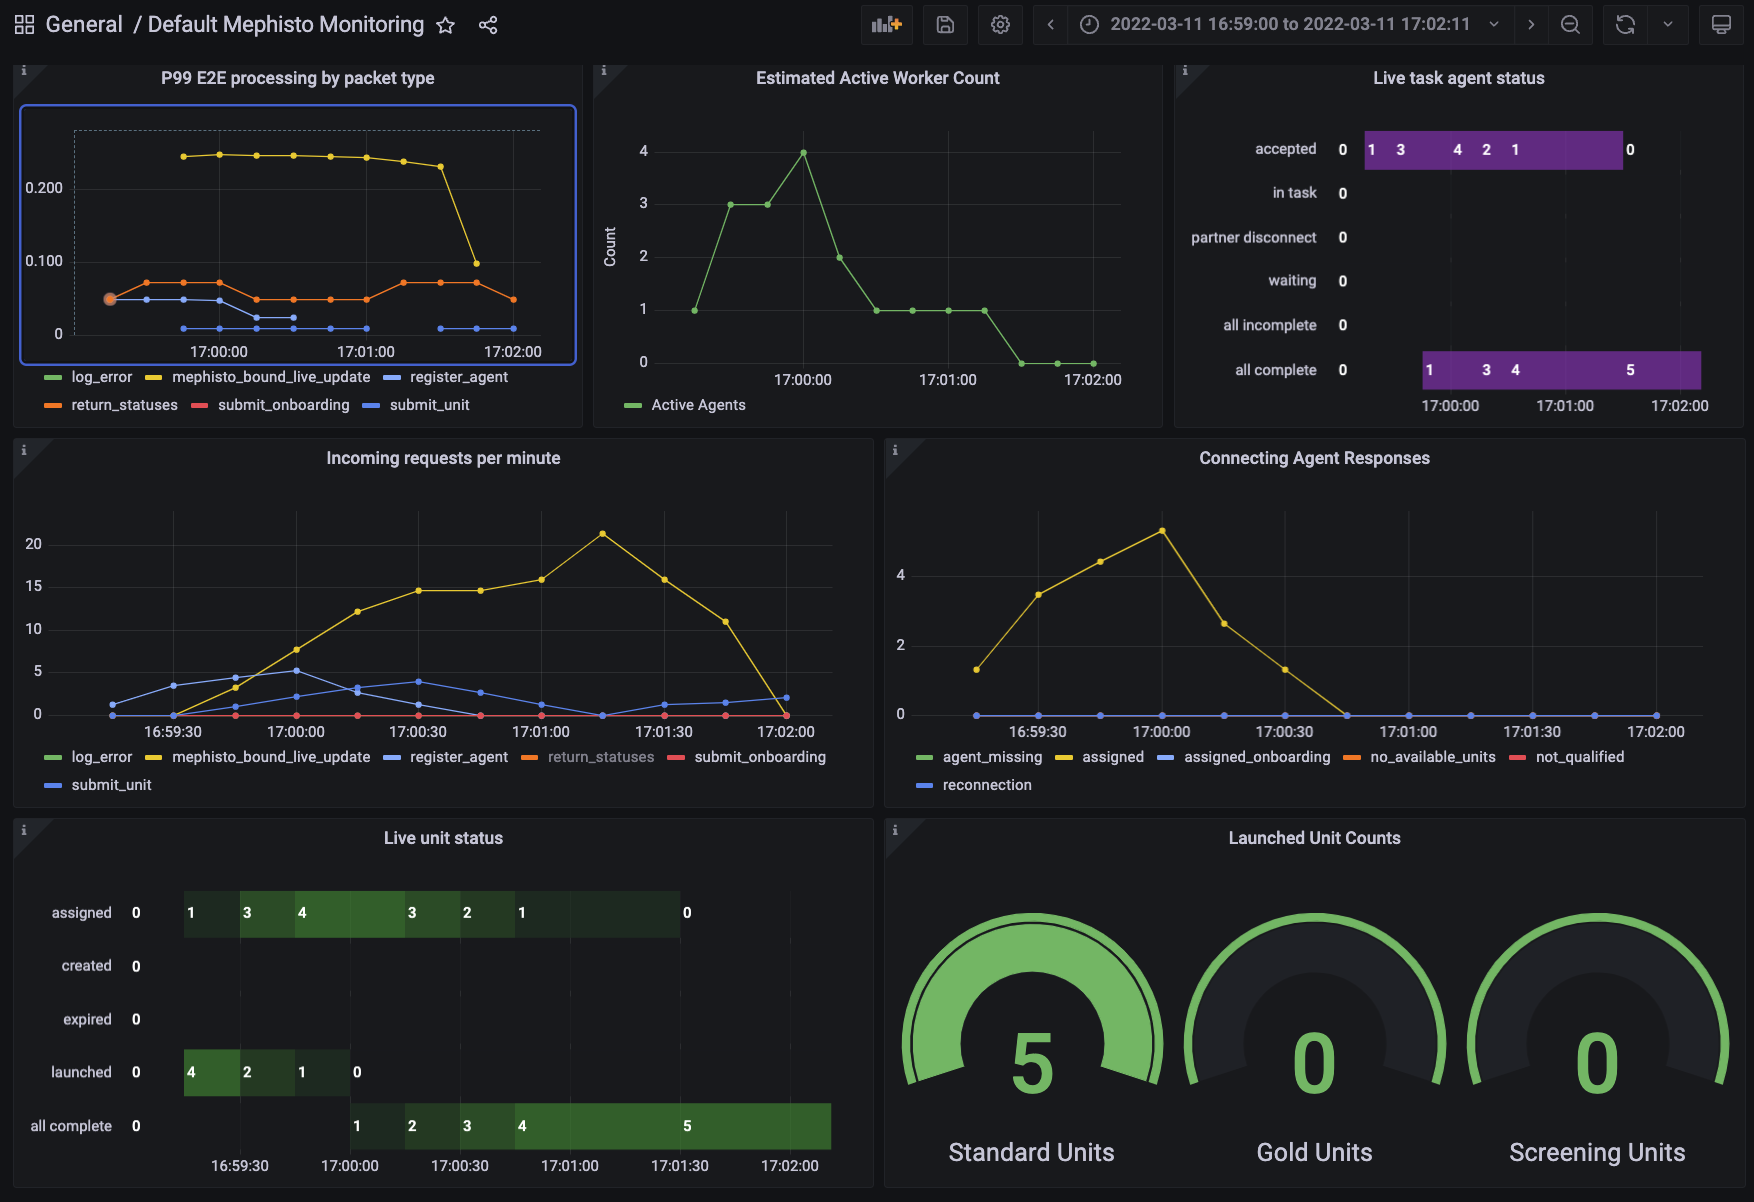
Here we can see the number of active workers, the requests per minute to Mephisto (as well as their types), the AgentState of all of the Agents that are associated with the current task as well as the units, and the total counts of units launched. A brief summary of what each of these do:
- P99 E2E processing by packet type: Displays the general health of requests coming into the server. These should never be exceeding a a few seconds, and would point to there being an overload on your server if so (wherein you can check the Operator Health and Network Health groups to debug!)
- Estimated Active Worker Count: Displays the active count of unique workers currently completing tasks. Estimated once every 15 seconds, so if a job completes within that timeframe it may not be counted.
- Live task agent status: Displays the current task status for all agents. Generally will progress through accepted/in_task to either complete or incomplete.
- Incoming requests per minute: Displays the requests that are hitting your Mephisto server. Here you may find that tasks aren't coming in because no
register_agentcalls are being made. Or perhaps you may want to look for a spike inlog_errorif you're having unexpected behaviors. - Connecting Agent Responses: This logs the response that mephisto provides to an agent creation request. This may show that the workers that are connecting aren't qualified, or that there aren't any available units for them after running unit filtration.
- Live unit status: This shows the current status of all units. It may be useful to see the numbers of units that are completing correctly or expiring.
- Launched unit counts: This shows the number of units that have been launched thusfar of all three categories. For tasks without gold units or screening units, you'll only see the standard units.
Operator Health
The Operator Health group is more focused on execution and runtime for jobs that the operator is looking at. Generally this is useful for debugging what may be going on 'under the hood' when unexpected behavior happens.
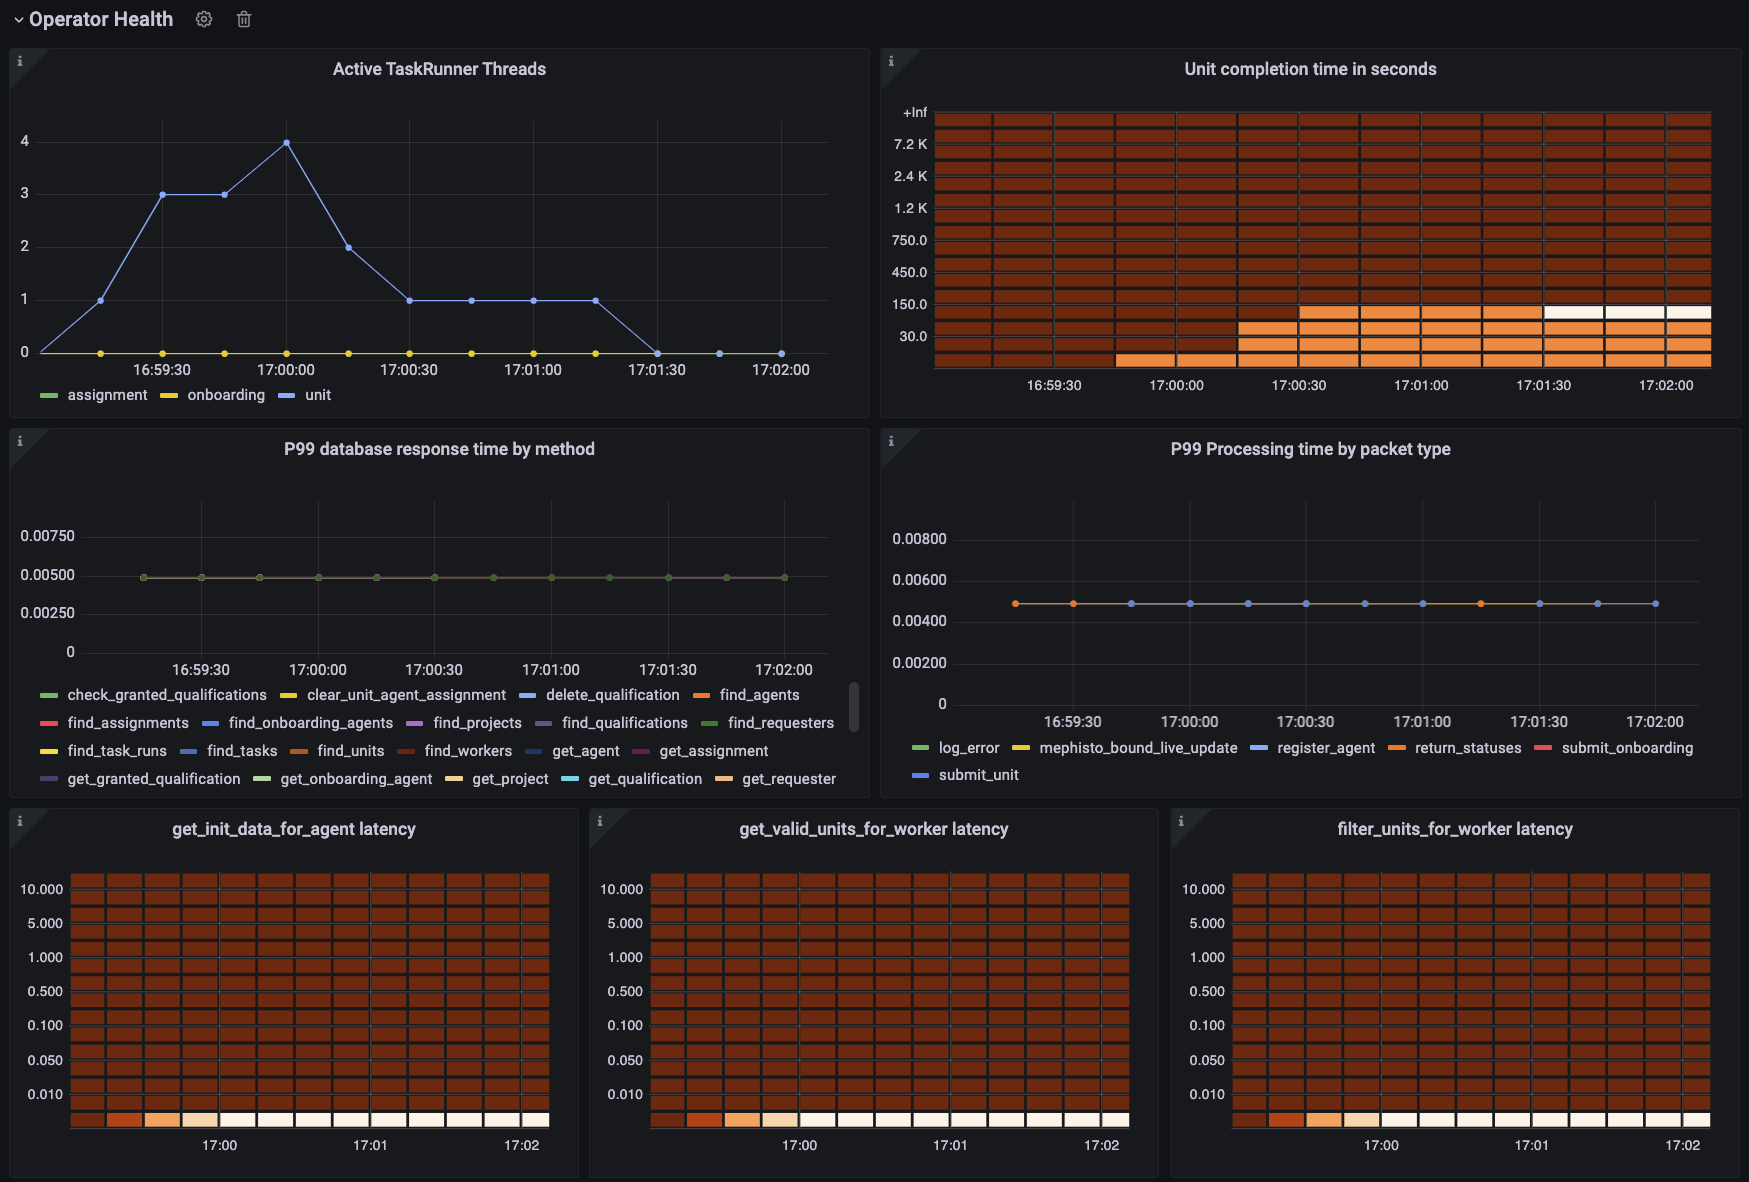
Here we track the threads being run for different jobs, the time it takes for tasks to complete, the database access health, operator-side processing time per packet type, and various latencies for steps in the process of assigning a unit to a connecting agent. A brief summary of what each of these do:
- Active TaskRunner Threads: Plots the threads for every unit, onboarding, or assignment active at a given time. You may look towards this to see if there are a healthy amount of active Units running compared to the number that are currently available.
- Unit Completion time in seconds: Plots the completion time for every Unit. Useful for tracking time buckets that workers are submitting tasks in. You can use this to see if the average completion times are shaping up as you expect them to.
- P99 database response time by method: Shows the response time of the local database divided by every method being run. Generally these number should be really low, and any spikes may point to an improper configuration (database on a distributed filestore?) or other issue.
- P99 Processing time by packet type: Shows the time it takes for the
ClientIOHandlerto process and respond to each packet type. Should generally be stable, but you may see spikes if you have too many active concurrent connections, or if your packets contain too much data for the system to handle. - get_init_data_for_agent latency: Heatmap of response time for this function. If this is high, it could point to requiring too many resources being read at assign time in order to create a task for a worker, which severely limits the number of active workers you can have connecting to a task at once.
- get_valid_units_for_worker latency: Heatmap of response time for getting valid units for a worker. If this is high, it points to an issue in
TaskRun.get_valid_units_for_worker, which could point to database issues querying for what's valid, or a delay in yourworker_can_do_unitfunction. The outcome is the same as the above. - filter_units_for_worker latency: Heatmap of response time for filtering units for a worker. If this is high, it points to an issue in your selected
Blueprint's method for fitering through with units a worker may be eligible for. The outcome is the same as the above.
Network Health
The network health group is useful for isolating where in the stack there may be issues preventing workers from accessing your tasks. The first section covers latency bucketed heatmaps and p99s by packet type for each step of the client reaching the mephisto router, the mephisto router processing the message, the router sending the Mephisto host a packet, and then the Mephisto host processing that packet. Spikes in any of these would point out where an issue is happening if there is one.
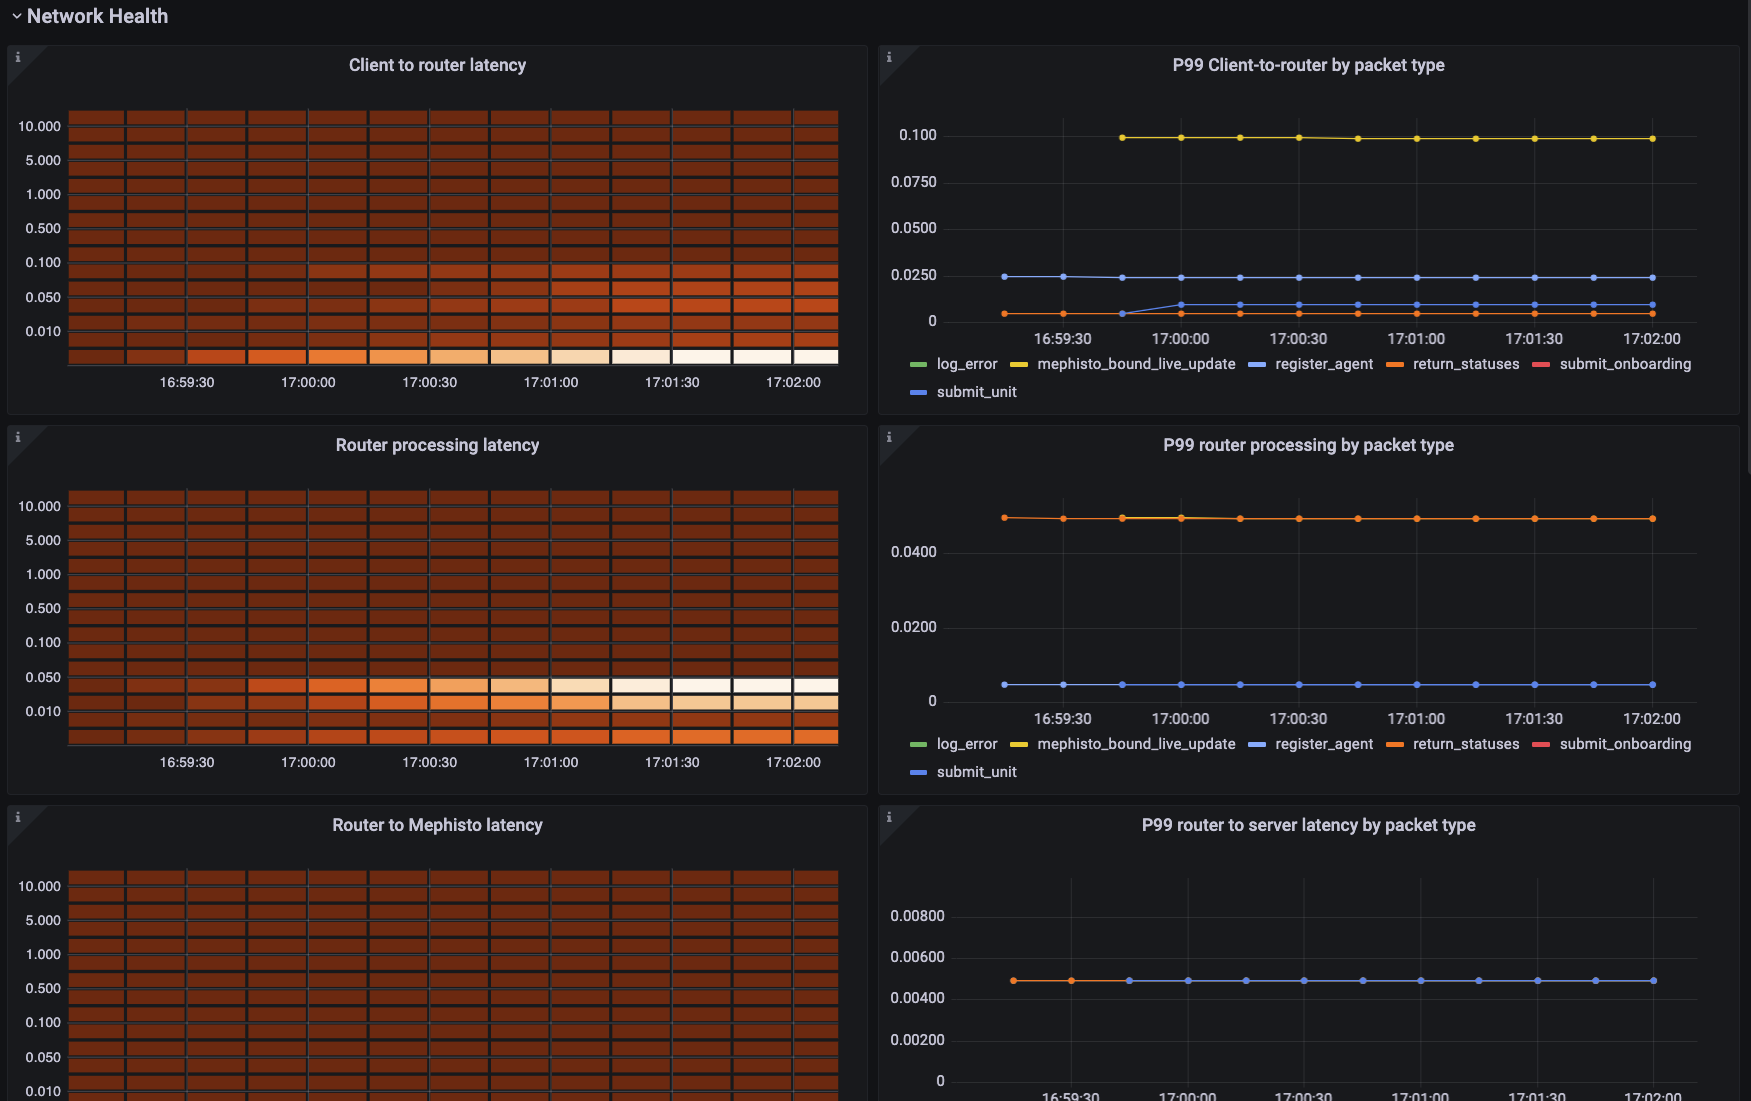
The second section covers the processing type of a few high-risk packet types over time, split by packet type.
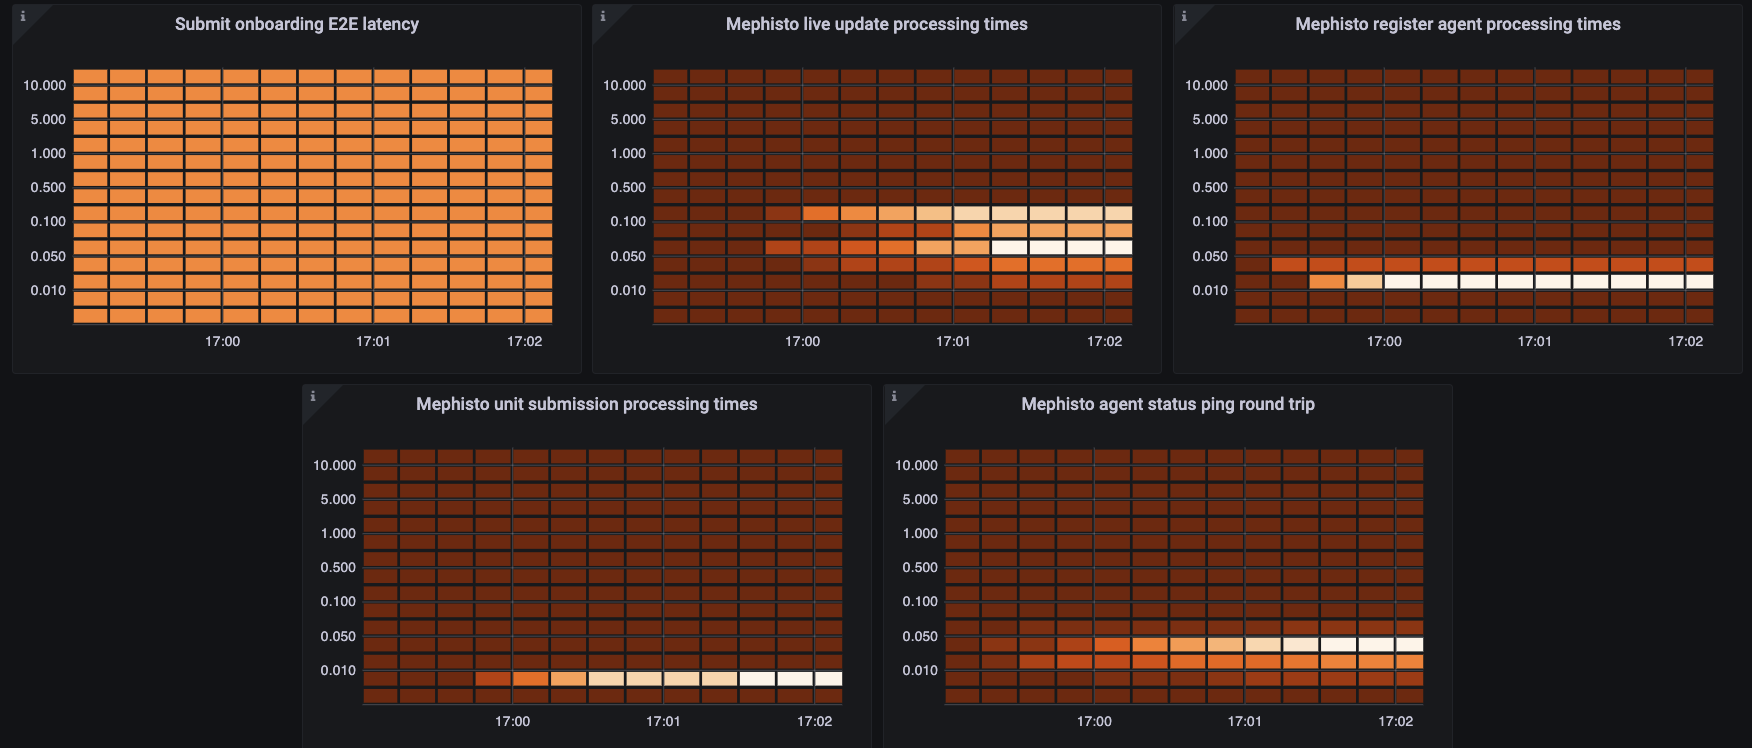
For this section, each of the plots can show the health of your system in a number of places:
- Submit onboarding E2E latency: Displays the time it takes to process an onboarding submission. May spike near the start of a task, when most of the people joining and submitting are still doing onboarding tasks.
- Mephisto live update processing times: Tracks how long it takes for mephisto to process and respond to
liveUpdates in-task. This is generally the most significant bottleneck formax_num_concurrent_unitsin any task that utilizes live updates. This directly represents the delay that workers are having in response to their changes. - Mephisto register agent processing times: Tracks how long it takes Mephisto to process and respond to an agent registering to join. This is the second most significant bottleneck for
max_num_concurrent_units, especially at the start of a task, as if workers aren't able to register they may delay each other and push the server into a failure state responding to requests that have already timed out. - Mephisto unit submission processing times: Tracks how long it takes to process and write to disk the submission of a unit. Spikes here may mean that you need to be a little more cautious about how much data is being saved at a time.
- Mephisto agent status ping round trip: Tracks how long it takes Mephisto to get updates from the router as to who is connected. Spikes here would mean that Mephisto is unable to have up-to-date understanding of which agents are connecting, and would point to an unknown issue in the router. (Please open an issue if you see this!)
Onboarding and Other Validation Metrics
Similarly to the above dashboards, these panels provide details about onboarding-specific or other validation-specific processes.